Verbos / Data
Bar chart race and animated chart maker
Paste a table and get an animated chart: bar chart race, lines, stacked areas, columns or donut. Built for explainer videos, exported as MP4.
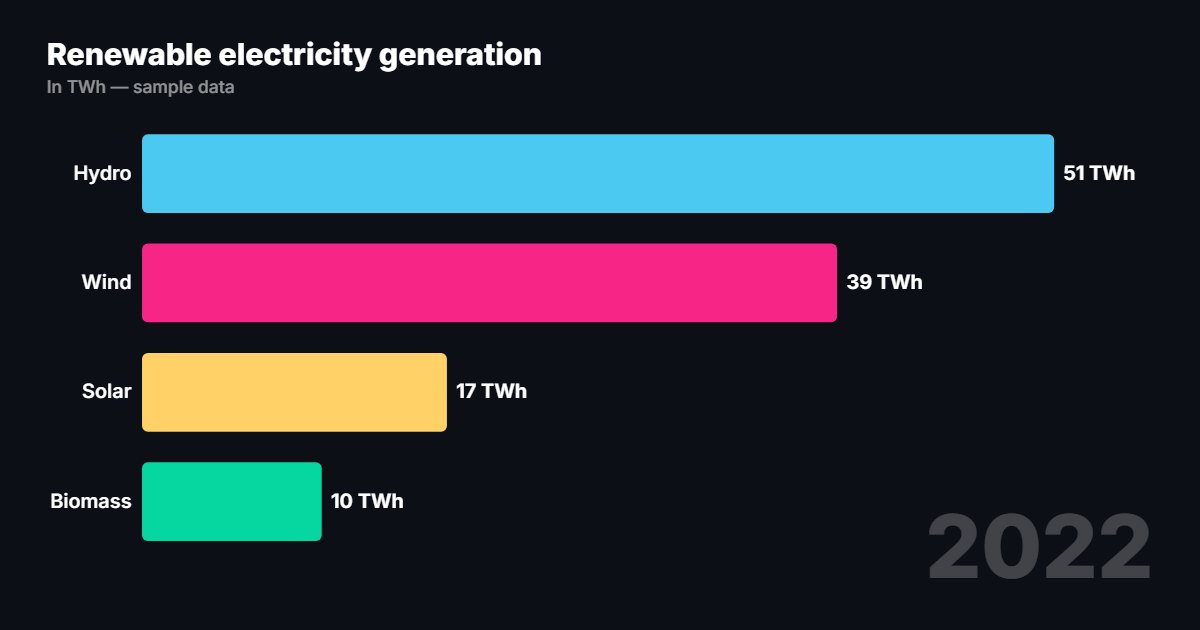
What is “Animated charts”?
The animated chart tool turns a table pasted from Excel, Google Sheets or a CSV into a bar chart race, line chart, stacked areas, columns or a donut. Values count up, key series can be highlighted and the source is shown on screen.
- Tool
- 📊 Animated charts
- In short
- 5 types · pasted table · palettes
- Privacy
- Everything happens in your browser: no file is uploaded.
What it is for
Economics explainer
Run twenty years of data as a bar chart race, with the series you talk about highlighted.
News video
A clean, press-style line chart to show how a figure changed, with the source at the bottom of the screen.
Report or presentation
An animated donut or columns for a breakdown, ready to drop into an edit.
How to use it
- Paste your table: first column for the periods, first row for the series names.
- Choose the chart type and the palette.
- Set the unit, decimals, duration and the series to highlight.
- Export as MP4, from 9:16 to 4K.
Ready-made styles
Frequently asked questions
- How do I make a bar chart race?
- Pick the “Bar chart race” type and paste a table with one row per period (year, month…): the bars keep reordering between periods.
- Do I need a Google account or a file?
- No, a simple copy and paste of the table is enough. The data stays in your browser.
- Can I fix the scale?
- Yes, the “Fixed scale” option stops the bars from rescaling, useful to compare periods.