Verbos / Maps
Animated map maker for videos
Make an animated map for your video: countries filling in step by step, arrows, points, legend and a 3D globe. Runs in your browser, exports MP4.
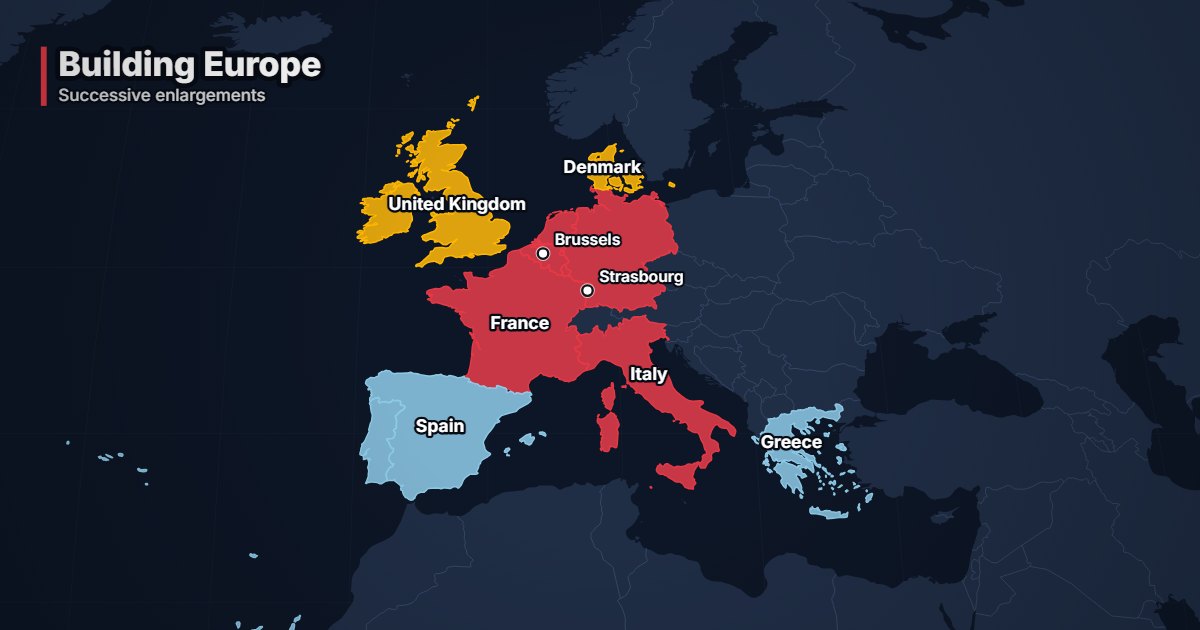
What is “Geopolitical map”?
The geopolitical map animates countries filling in step by step, with arrows, cities, a legend and a camera moving from one area to the next. Use it to tell a story on a map: alliances, conflicts, enlargements, spheres of influence. Base maps come from Natural Earth, with no tiles and no API key.
- Tool
- 🌍 Geopolitical map
- In short
- 4 projections · 3D globe · arrows, markers, legend
- Privacy
- Everything happens in your browser: no file is uploaded.
What it is for
Show the enlargement of the European Union wave by wave, with a colour and a date for each step, then pull the camera back over the whole of Europe.
Colour the members of an alliance, draw arrows for flows or offensives, and pin the capitals involved.
A clean, press-style map to place an event in a few seconds, in vertical format for social media.
How to use it
- Write your steps, one per line: countries joined with “+”, then an optional colour and comment (“France + Italy | #e63946 | 1957”).
- Add arrows (“From > To”), cities (34,000 recognised) and a legend if needed.
- Choose the projection (world map, Mercator, 3D globe), the theme and the camera move.
- Export as MP4, from 9:16 to 4K.
Ready-made styles
Frequently asked questions
- Are the borders up to date?
- Base maps come from Natural Earth, the free reference used by newsrooms and cartographers. They show de facto borders at world scale.
- Can I make a spinning globe?
- Yes: the “3D globe” projection turns the Earth towards each step.
- Can I use my own colours?
- Yes, the “Custom…” theme lets you pick oceans, land, borders and text, on top of the colour of each step.